Looker Studio dashboards
Looker Studio is a powerful tool that turns complex data into clear visual insights. The dashboards we create provide marketers and business leaders with a quick overview of key KPIs, helping them spot growth opportunities and make informed, data-driven decisions.
If you’re looking to get the most out of your marketing data and make smarter choices, MBD Looker Studio Dashboards is the way to go.
What’s Included in MBD Looker Studio Dashboard Service?
Data Integration
We bring all your key data sources – Meta, Google Ads, GA4, LinkedIn, DV360, and more – into one place, giving you a complete overview of your marketing activities without the need to chase data across multiple platforms.
Data Visualization
We design informative charts and dynamic reports that highlight website traffic, campaign performance, and key KPIs. This gives you the clarity you need to make smarter, more effective marketing decisions.
Our Dashboard Solutions:
- Campaign Dashboard
The Campaign Dashboard brings together data from all your marketing channels and website traffic into one clear view. It lets marketers track campaign performance in real time—saving valuable hours that would otherwise go into gathering data from multiple sources. Instead of getting lost in numbers, you can focus on what matters: results. Instantly see which channels are working and where it makes sense to invest more.
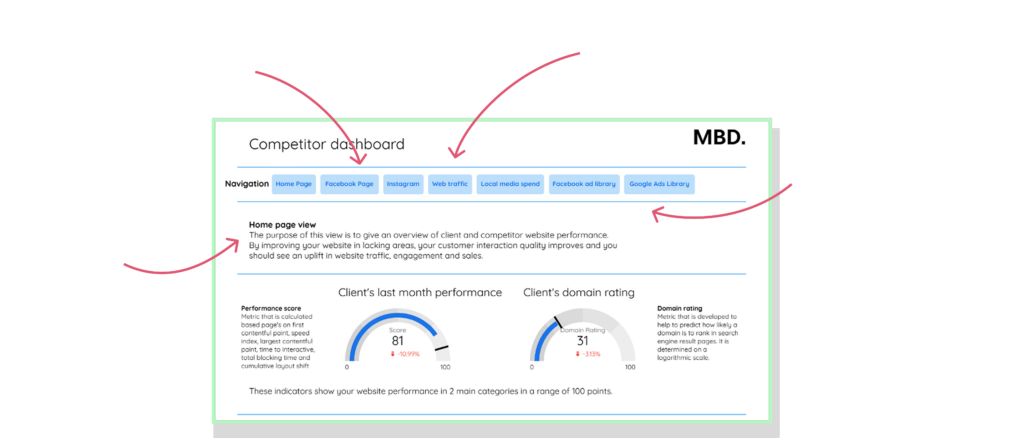
- Competitor Dashboard
A smart tool that gathers all key data about your competitors’ digital activity into one user-friendly platform. The MBD Competitor Dashboard provides real-time insights into your competitors’ ad spending, marketing channels, website traffic, social media performance, and the effectiveness of their ads. It’s an ideal solution for understanding your position in the market and building data-driven strategies based on what your competitors are actually doing.
- SEO Dashboard
The SEO Dashboard gives you a clear picture of how Google sees your website. You’ll see which search terms your site ranks for in organic results and how these positions change over time. When there’s a major shift—whether it’s a drop or a sudden boost—you’ll be the first to know and can respond quickly if needed. It’s a powerful way to stay in control of your site’s visibility and content performance.
- Website Traffic Dashboard (GA4)
Built on Google Analytics 4, this dashboard brings together all key metrics—visits, user behavior, and trends—into a single, easy-to-read view. While GA4 offers a wide range of features, finding the right data can still be time-consuming. Our dashboard saves you time by consolidating essential stats into one streamlined report.
- Social Media Dashboard
The Social Media Dashboard offers a clear overview of both organic and paid content performance on Facebook and Instagram. It shows how your posts perform, tracks campaign stats, and compares results across periods. It’s a great tool for evaluating content and ad performance and for confidently planning your next moves.
Want to get more out of your data? We’ll help you see the full picture— visually and in real time. Get in touch, and we’ll build you a custom dashboard that puts key insights at your fingertips and supports smarter decisions.